phased.ReplicatedSubarray.viewArray
View array geometry
Description
viewArray(
plots the geometry of the array, with additional options specified by one or more
array
,Name,Value
)Name,Value
pair arguments.
returns the handles of the array elements in the figure window. All input arguments
described for the previous syntaxes also apply here.hndl
= viewArray(___)
Examples
Array of Replicated Hexagonal Arrays on a Sphere
This example shows how to construct a full array by replicating subarrays.
Create a hexagonal array to use as a subarray.
Nmin = 9; Nmax = 17; dy = 0.5; dz = 0.5*sin(pi/3); rowlengths = [Nmin:Nmax Nmax-1:-1:Nmin]; numels_hex = sum(rowlengths); stopvals = cumsum(rowlengths); startvals = stopvals-rowlengths+1; pos = zeros(3,numels_hex); rowidx = 0; for m = Nmin-Nmax:Nmax-Nmin rowidx = rowidx+1; idx = startvals(rowidx):stopvals(rowidx); pos(2,idx) = (-(rowlengths(rowidx)-1)/2:... (rowlengths(rowidx)-1)/2) * dy; pos(3,idx) = m*dz; end hexa = phased.ConformalArray('ElementPosition',pos,... 'ElementNormal',zeros(2,numels_hex));
Arrange copies of the hexagonal array on a sphere.
radius = 9; az = [-180 -180 -180 -120 -120 -60 -60 0 0 60 60 120 120 180]; el = [-90 -30 30 -30 30 -30 30 -30 30 -30 30 -30 30 90]; numsubarrays = size(az,2); [x,y,z] = sph2cart(deg2rad(az),deg2rad(el),... radius*ones(1,numsubarrays)); ha = phased.ReplicatedSubarray('Subarray',hexa,... 'Layout','Custom',... 'SubarrayPosition',[x; y; z], ... 'SubarrayNormal',[az; el]);
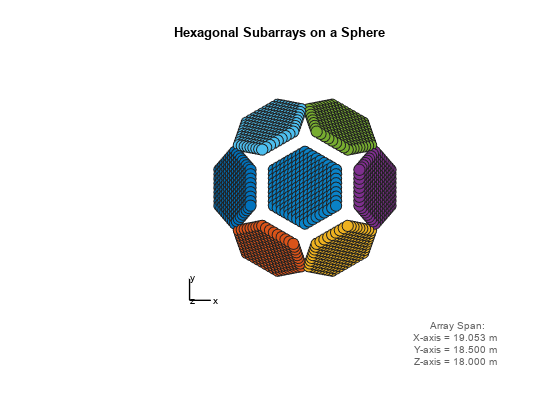
Display the geometry of the array, highlighting selected subarrays with different colors.
viewArray(ha,'ShowSubarray',3:2:13,... 'Title','Hexagonal Subarrays on a Sphere'); view(0,90)
Highlight Overlapped Subarrays
Display the geometry of a uniform linear array having overlapped subarrays.
Create a 16-element ULA that has five 4-element subarrays. Some elements occur in more than one subarray.
h = phased.ULA(16); ha = phased.PartitionedArray('Array',h,... 'SubarraySelection',... [1 1 1 1 0 0 0 0 0 0 0 0 0 0 0 0;... 0 0 1 1 1 1 0 0 0 0 0 0 0 0 0 0;... 0 0 0 0 1 1 1 1 0 0 0 0 0 0 0 0;... 0 0 0 0 0 0 0 0 1 1 1 1 0 0 0 0;... 0 0 0 0 0 0 0 0 0 0 0 0 1 1 1 1]);
Display the geometry of the array, highlighting all subarrays.
viewArray(ha);
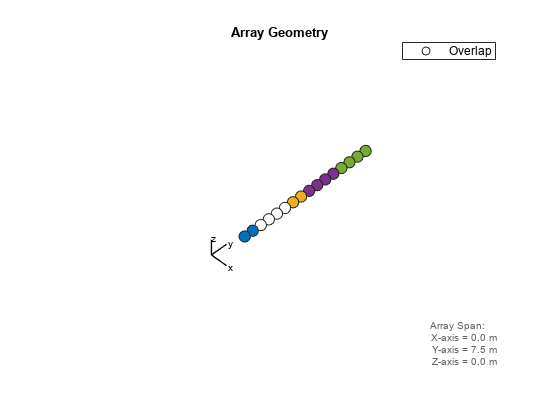
Each color other than white represents a different subarray. White represents elements that occur in multiple subarrays.
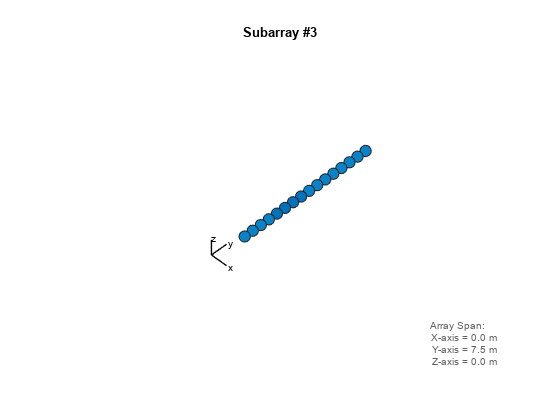
Examine the overlapped subarrays by creating separate figures that highlight the first, second, and third subarrays. In each figure, dark blue represents the highlighted elements.
for idx = 1:3 figure; viewArray(ha,'ShowSubarray',idx,... 'Title',['Subarray #' num2str(idx)]); end
Input Arguments
array
— Phased array System object
System object™
Phased array, specified as a System object.
Name-Value Arguments
Specify optional pairs of arguments as
Name1=Value1,...,NameN=ValueN
, where Name
is
the argument name and Value
is the corresponding value.
Name-value arguments must appear after other arguments, but the order of the
pairs does not matter.
Before R2021a, use commas to separate each name and value, and enclose
Name
in quotes.
Example: ShowNormals = true,ShowIndex = 'All',ShowTaper =
true
Parent
— Handle to axes
real-valued scalar
Handle to the axes along which the array geometry is displayed.
ShowNormals
— Option to show normal vectors
false
(default) | true
Option to show normal directions, specified as the comma-separated
pair consisting of 'ShowNormals'
and a logical value.
true
— show the normal directions of all elements in the arrayfalse
— plot the elements without showing normal directions
Example: false
Data Types: logical
ShowLocalCoordinates
— Show local coordinates
true
(default) | false
Logical flag specifying whether to show the local coordinate axes.
Data Types: logical
ShowAnnotation
— Show aperture size and element spacing annotations
true
(default) | false
Logical flag specifying whether to show the annotations in the UI panel of the figure. Annotation shows aperture size and element spacing based on array axis of array.
Data Types: logical
Orientation
— Orientation of the array
[0;0;0]
(default) | 3-by-1 column vector with real values
Orientation of the array, specified as a 3-by-1 column vector containing the rotation angles with respect to the x-, y-, and z-axes of the local coordinate system, respectively. The default value is [0;0;0].
Data Types: double
ShowTaper
— Option to show taper magnitude
false
(default) | true
Option to show taper magnitude, specified as the comma-separated pair
consisting of 'ShowTaper'
and a logical value.
true
— change the element color brightness in proportion to the element taper magnitudefalse
— plot all elements using the same color
Example: true
Data Types: logical
ShowIndex
— Element indices to show
'None'
(default) | vector of positive integers | 'All'
Element indices to show in the figure, specified as the
comma-separated pair consisting of 'ShowIndex'
and a
vector of positive integers. Each number in the vector must be an
integer between 1 and the number of elements. To show all of indices of
the array, specify 'All'
. To suppress all indices,
specify 'None'
.
Example: [1,2,3]
Data Types: double
ShowSubarray
— Subarray indices
'All'
(default) | index valued vector
Vector specifying the indices of subarrays to highlight in the figure.
Each number in the vector must be an integer between 1 and the number of
subarrays. You can also specify the value 'All'
to
highlight all subarrays of the array or 'None'
to
suppress the subarray highlighting. The highlighting uses different
colors for different subarrays, and white for elements that occur in
multiple subarrays.
Data Types: double
Title
— Plot title
'Array Geometry'
(default) | character vector
Plot title, specified as a character vector.
Example: 'My array plot'
Data Types: char
| string
Output Arguments
hndl
— Handle of array elements plot
scalar
Handle of array elements plot in the figure window, returned as a scalar.
Version History
Introduced in R2012a
Comando de MATLAB
Ha hecho clic en un enlace que corresponde a este comando de MATLAB:
Ejecute el comando introduciéndolo en la ventana de comandos de MATLAB. Los navegadores web no admiten comandos de MATLAB.
Select a Web Site
Choose a web site to get translated content where available and see local events and offers. Based on your location, we recommend that you select: .
You can also select a web site from the following list:
How to Get Best Site Performance
Select the China site (in Chinese or English) for best site performance. Other MathWorks country sites are not optimized for visits from your location.
Americas
- América Latina (Español)
- Canada (English)
- United States (English)
Europe
- Belgium (English)
- Denmark (English)
- Deutschland (Deutsch)
- España (Español)
- Finland (English)
- France (Français)
- Ireland (English)
- Italia (Italiano)
- Luxembourg (English)
- Netherlands (English)
- Norway (English)
- Österreich (Deutsch)
- Portugal (English)
- Sweden (English)
- Switzerland
- United Kingdom (English)